Livibility Map
Data-Driven Neighborhood Optimization
Livibility Map
Data-Driven Neighborhood Optimization


Data-Driven Neighborhood Optimization
Data-Driven Neighborhood Optimization
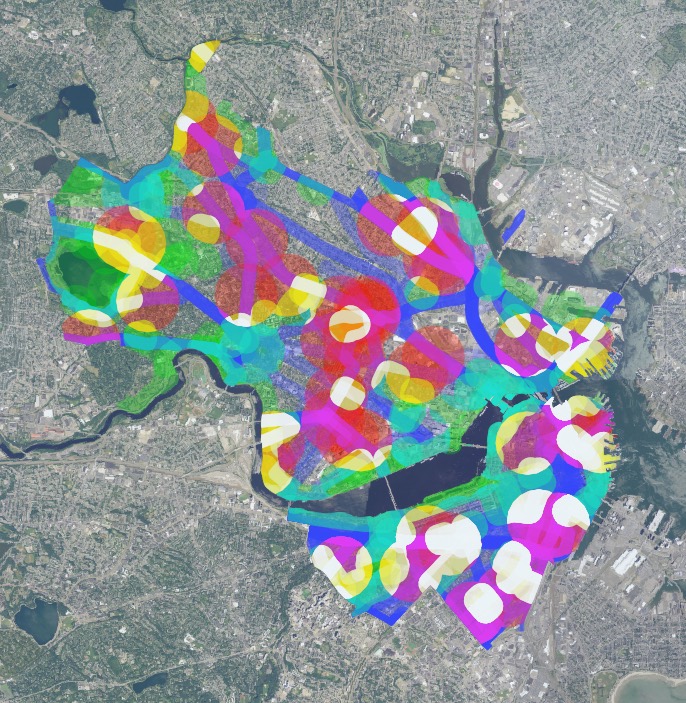
This was a personal project to practice GIS and to choose areas of Boston that are ideal in terms of my definition of livibility.
A compelling map to choose my next apartment.
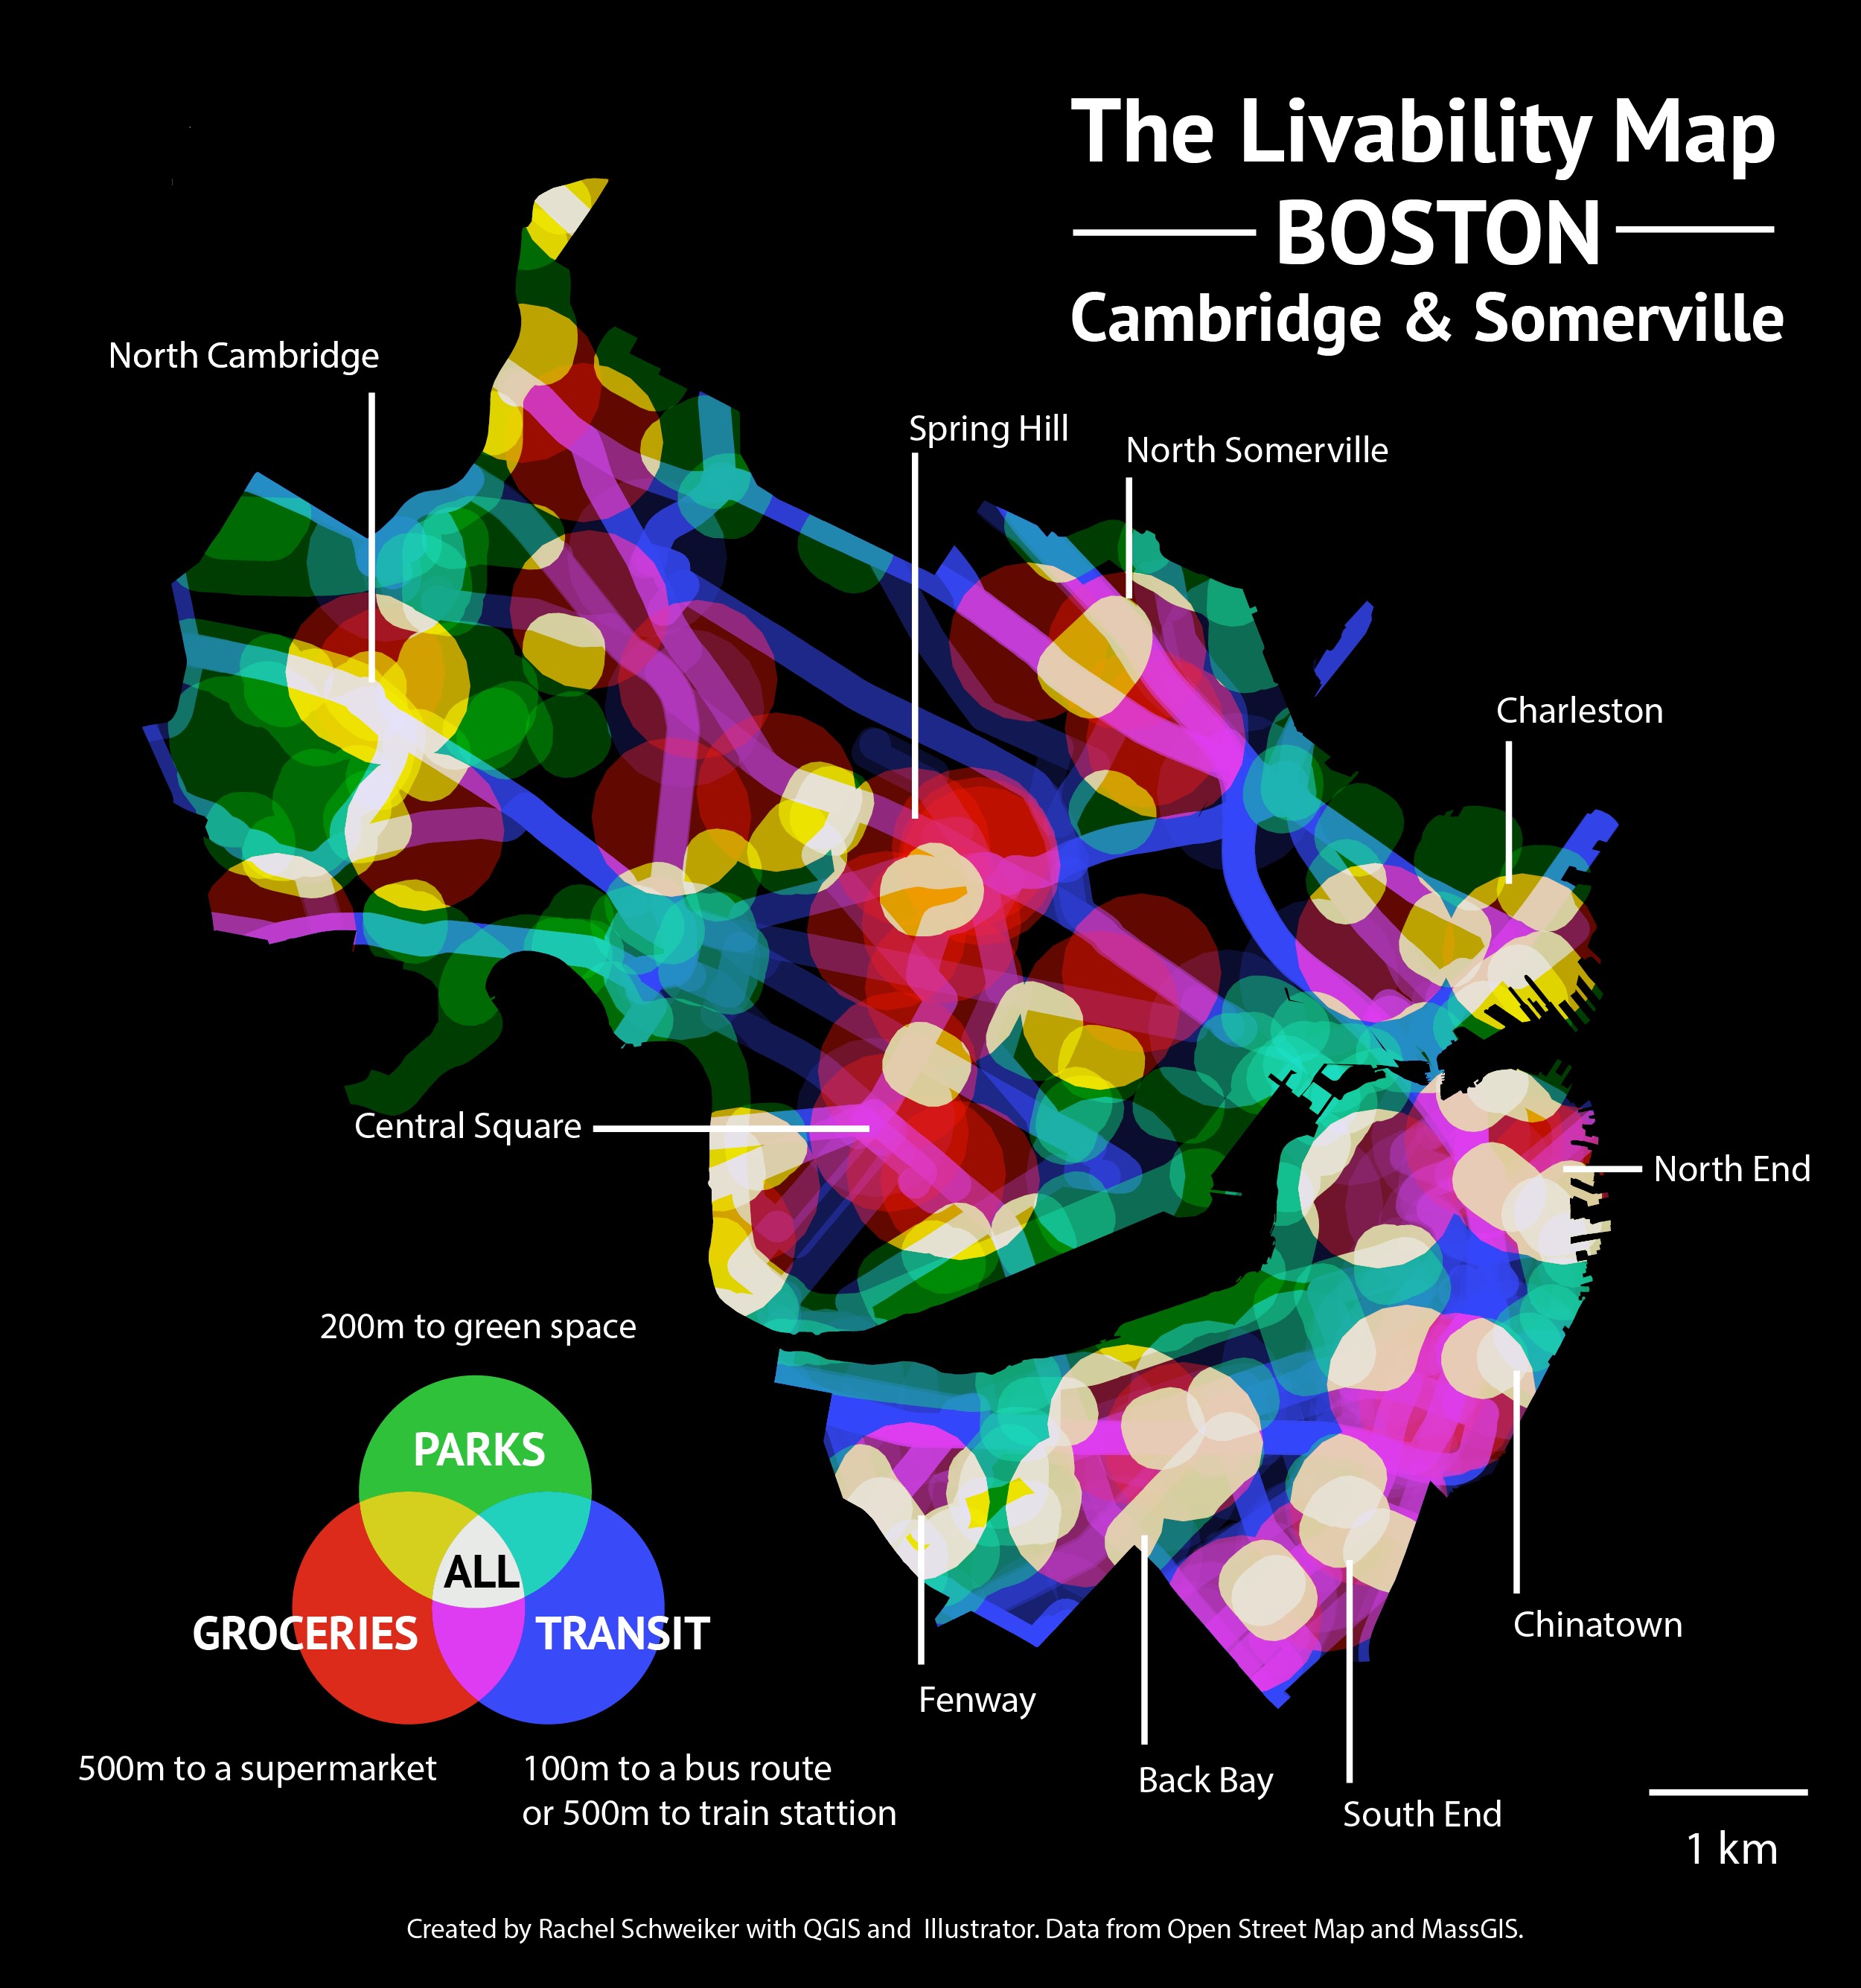
I like to avoid using a car in the city, so it's important that I live nearby public transit, a park, and a grocery store. Data was collected from MassGIS and OpenStreetMap.
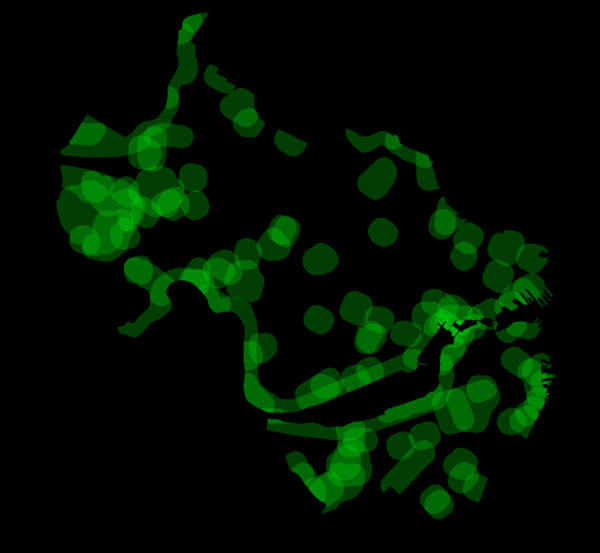
Diving into the GIS jargon right away... the park data is from Open Street Map, from the multipolygon layer I selected all the parks, allotments, gardens, recreation grounds; anything that would be a green space. I added a area column to the attribute table and selected the green spaces that were larger than 7000m^2. The transit data is the arc bus shapefile and the mbta stop station shapefile from MassGIS. I tried to collect the supermarket data from Open Street Map but it seemed to miss many of the stores, so I individually mapped each one.
All layers were projected in WGS 84 / UTM Zone 19N. The trick with this is to open the layers and save them with a selected CRS, and open that layer. This process means the “on the fly” reprojection option can be turned off. All layers were buffered – parks to 200m, supermarkets to 500m, bus routes to 100m, and T stations to 500m. Then they were clipped to the neighborhood layer, which was made by selecting features from the place section in the OSM multipolygon layer. The combination layers were made by clipping as well. I tried using intersection at first but this takes too long and conserving all the features does not make sense in this situation.


I exported the map as a SVG using a QGIS plugin and added the labels and the venn diagram legend in Illustrator. I'm hoping to make this into an online application in my free time - for any city a user chooses the three most important features for their livibility requirements and the app automatically renders a map available for download or printing.